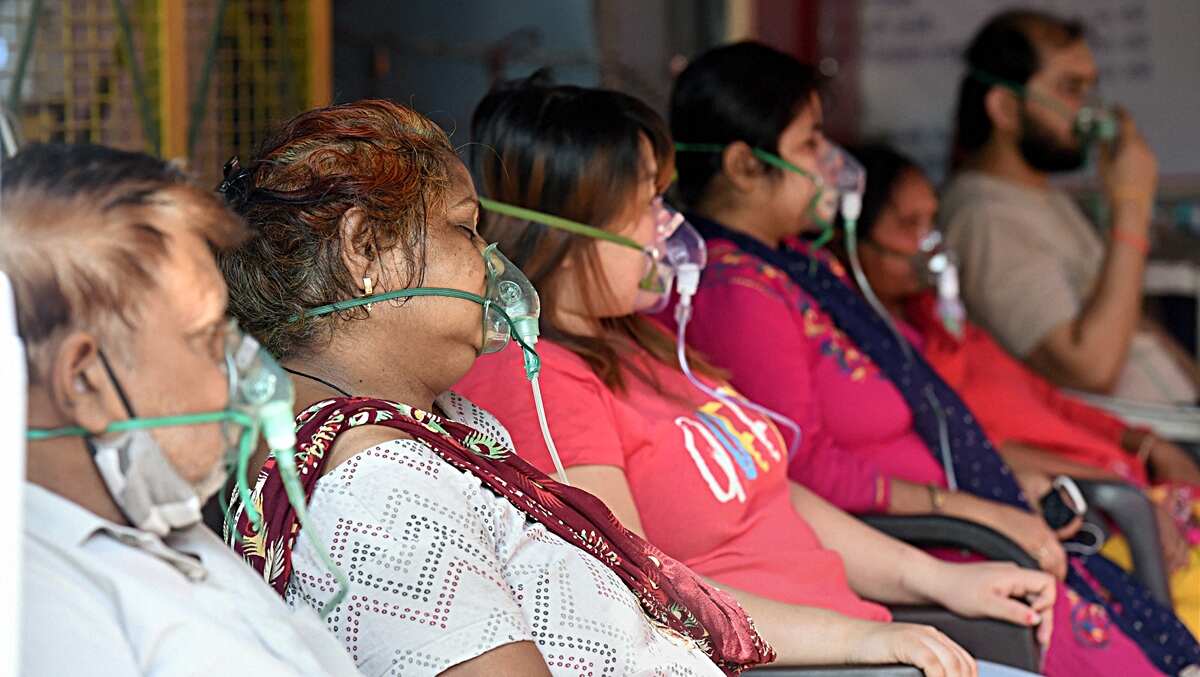
COVID 19 has become more lethal in the second wave.
Ever since COVID broke ground, Nations, states within federal structures, local governing bodies and various organisations collect, collate and publish numbers relating to the pandemic. Covid performance is now about numbers; number infected, hospitalised, recovered, dead etc. These are available in the public domain. Each of these can be used the way one wants to. When performance is about numbers, it can also be contested. Here numbers in the public domain are considered, uncontested.
Data Base
The daily numbers reported are in absolute terms. However, to even out spikes, a moving seven-day average is considered. It provides a better understanding of the trend. Linking confirmed cases to deaths as percentages gives the prevailing covid mortality. Details with respect to three states, Maharashtra, Karnataka and Kerala are given below was collated. ‘Death/Case’ has been calculated from the data available. An increase in cases and deaths as percentage growth from the previous day has also been plotted for each state.
| Date | Maharashtra Cases7 -Day Avg | Death7 -Day Avg | Death toCase Ratio | Karnataka Cases7 -Day Avg | Death7 -Day Avg | Death toCase Ratio | Kerala Cases7 -Day Avg | Death7 -Day Avg | Death to Case Ratio | ||
| 16-May | 34,404 | 941 | 2.74% | 36,209 | 427 | 1.18% | 31,791 | 93 | 0.29% | ||
| 17-May | 32,594 | 909 | 2.79% | 35,291 | 420 | 1.19% | 30,439 | 96 | 0.32% | ||
| 18-May | 31,125 | 928 | 2.98% | 33,925 | 449 | 1.32% | 29,721 | 100 | 0.34% | ||
| 19-May | 29,880 | 1,009 | 3.38% | 32,428 | 446 | 1.38% | 29,228 | 107 | 0.37% | ||
| 20-May | 28,778 | 970 | 3.37% | 31,635 | 461 | 1.46% | 29,133 | 119 | 0.41% | ||
| 21-May | 29,138 | 969 | 3.33% | 30,473 | 470 | 1.54% | 31,066 | 124 | 0.40% | ||
| 22-May | 29,278 | 963 | 3.29% | 30,506 | 469 | 1.54% | 30,360 | 131 | 0.43% | ||
Coronavirus statistics – Bing[1]
Linearity
Test positivity Rate (TPR), represents the ratio of those found infected against the numbers tested. Higher TPR means more infected people amongst those tested. Ideally, the number of cases, TPR and number of deaths are linearly related. Conversely, as afflictions fall, TPR must fall and death must recede. Fortunately, TPR has been on the decrease for some time. It means that daily infections and therefore deaths should be coming down. But data suggests that even as TPR and daily confirmed cases were coming down ‘Death-to-Cases’ was behaving differently.
Cases To Death Ratio
| DATE | India | Maharashtra | Karnataka | Kerala |
| 28-Feb | 0.71% | 0.65% | 1.24% | 0.48% |
| 05-Mar | 0.58% | 0.48% | 0.73% | 0.60% |
| 10-Mar | 0.53% | 0.37% | 0.71% | 0.69% |
| 15-Mar | 0.50% | 0.36% | 0.37% | 0.72% |
| 20-Mar | 0.45% | 0.32% | 0.48% | 0.81% |
| 25-Mar | 0.45% | 0.33% | 0.35% | 0.60% |
| 30-Mar | 0.51% | 0.38% | 0.47% | 0.58% |
| 04-Apr | 0.52% | 0.51% | 0.43% | 0.46% |
| 09-Apr | 0.51% | 0.52% | 0.47% | 0.33% |
| 14-Apr | 0.50% | 0.52% | 0.43% | 0.21% |
| 19-Apr | 0.59% | 0.68% | 0.52% | 0.13% |
| 24-Apr | 0.73% | 0.99% | 0.56% | 0.10% |
| 29-Apr | 0.89% | 1.33% | 0.58% | 0.12% |
| 04-May | 0.94% | 1.40% | 0.60% | 0.15% |
| 09-May | 1.07% | 1.57% | 1.06% | 0.17% |
| 14-May | 1.26% | 2.12% | 1.14% | 0.26% |
| 19-May | 1.59% | 3.38% | 1.38% | 0.37% |
Note: The second wave commenced in March, hence data from March
Data indicates that through March 2021, the death to cases ratio decreased, stabilised in April and then increased. Though interstate differences are significant, the increasing pattern is similar.
Kerala stood out different. From February to mid-March Kerala posted growing death rates but controlled it and brought it down by mid-April. Obviously, there was something at work. It had to be identified and addressed to control deaths.

Discounting Lag
A comparison of daily numbers and deaths show the difference. On 05th May, ‘All India’ number of daily cases hit the highest at 4,12,262 (39,1280, 7-day average). The deaths reported that day was 3,784 (3770, 7-day average). Considering the incubation period of 2 to 14 days once contacted one can test positive within 14 days. The patient’s condition could deteriorate during this time or later. Therefore, a lag between daily confirmed cases and death is inevitable. This also could also range between 7 to 14 days. Thus, the number of dead could continue rising for 7 to 14 days after the peak of the case but should ideally fall thereafter in line with the decrease in cases. If cases peaked on 5th May, death should have peaked latest by 19th or 20th May and then descend.
The Mystery
Progress of cases and deaths plotted as percentage growth from the previous measure mark, gives a clearer picture. The graph clearly debunks linearity between cases and deaths. Even as the number of cases decreased more people were dying! Another intriguing aspect is that, though the growth of ‘death’ generally overtook growth of ‘cases’ during the period, end march – early April, there has been no uniformity in the difference. Each state shows different patterns, strongly suggesting regional influence. However, clearly, the increase in death shows an upward trend compared to the downward trend of cases.


Solving the Mystery
Is increasing death rate driven by shortages? Oxygen, hospital beds, medicines?
The second wave acceleration commenced in March. It peaked by end of April. Hospital beds and oxygen ran short. Many deaths could have been avoided but for such inadequacies. Soon facilities were augmented and the situation declared eased. Since infrastructural inadequacies impact linearly, death should have increased when oxygen, beds and medicines were running short and eased when these were addressed. Moreover, with cases falling, load on infrastructure should have eased and deaths should have fallen even further. Vaccination, despite what it is, should also have had some impact. The graph gives a different picture.
Believing numbers available, all India growth in the rate of death crossed growth in cases around 26 March. It fell back only to run away in the third week of April. Soon it started showing congruence to the drop in cases. This may correspond to the period when shortages were addressed. However, by the second wave of May, even as oxygen and bed shortages were addressed, the gap in rates between the two started increasing. Clearly more people amongst the infected were dying compared to the previous periods even when medicines and oxygen were being made available. Why?

Deadly Second Wave?
Is the second wave virus deadlier?
The primary aim of the virus is replication, for which the virus needs to spread. Spread depends on virulence. Scientists have confirmed enhanced virulence of the mutated strain. Though people die from covid, the dead body is the ‘dead end’ for the virus. After all, herd immunity is the ecological equilibrium between the virus and its host. No proof has emerged for enhanced lethality. With no scientific basis to prove, we cannot attribute increasing deaths to enhanced lethality. The second wave virus may not be deadlier than the first.
Comorbidity? It is said that those with underlying medical conditions are more likely to succumb to covid than others. Since comorbidity is common to both the waves, it cannot be causing such dissonance in the linearity of relations.
What else could be the reason?
Have we missed something about virulence? Are we doing something different this time from what we did earlier – something impacting management or treatment protocol?
Plausible Argument?
During the first wave, people who contracted the virus were isolated early and treated at medical facilities. This time around, people testing positive are advised to stay home till they have real difficulties. This has been done primarily to reduce the load on medical facilities. Now consider these:
- Almost everyone with some means is now in possession of a pulse oximeter and a covid treatment kit
- Most have managed oxygen concentrators or cylinders and if they haven’t, they at least have the promise of one.
- Almost everybody believes that there is no treatment for corona and treatment is required only for complications that develop from it.
- The confusion about which medicines to be administered or not as well as the shifting stands on treatment protocols, publicly aired on National Television also seems to suggest elements of incoherence in how covid is managed.
- Under such circumstances, people prefer staying home as long as they can.
- Most of them report to hospitals when they are critical.
- Are the increasing deaths attributable to worsening complications that could have been avoided if they had accessed medical care earlier?
Is the policy shift, allowing people to stay home till conditions worsen, silently pushing the death rate up?
Kerala Model
Despite the surge and continuing influx of overseas Indians, Kerala continues to have very low mortality rate.
The public health infrastructure of Kerala is at par with that of Europe or America. Citizens have access to professional medical care close at hand. Most primary health centres are manned by qualified medical and paramedical professionals. Despite rising infections and high incidence of hypertension and diabetes even in rural areas, the death rate of the state remains the lowest. The increase in death rate and surge in numbers of cases are within the lag period of incubation and deterioration. The continued hike in cases in April especially in the last week seems to push up the death rate. The rate shows fall in line with cases. Could early access to professional medical care be the factor?
Vigil – The Need
Early access to professional medical care may just be one reason. There could be one or more of it. But there is a need to identify it as soon as possible.
With the third wave imminent, there is no way it can be wished away. Lawmakers, administrators, medical professionals and citizens need to put their heads together and find that cause. It may help us save lives. Confusion is inherent to pandemics, but getting over it, the lifeline to millions, the faster the better.
End Note
[1] All these data have been picked up from the public domain (Coronavirus statistics – Bing ). It has been rechecked as on 25 May 1718 hrs. The data used is only for discussion purposes and is NOT from any government officials
Article courtesy: https://jacobshorizon.blogspot.com/2021/05/covid-missing-something-amongstthe.html
Title image courtesy: https://indianexpress.com/article/india/covid-19-second-wave-which-states-have-raised-oxygen-crisis-with-centre-7306165/
Disclaimer: The views and opinions expressed by the author do not necessarily reflect the views of the Government of India and Defence Research and Studies