The microcredit facilities that are imparted by Microfinance Institutions (MFIs) to the low-income clientele, usually in the form of small loans for microenterprises and income-generating activities have been linked with increasing financial inclusion in India. This study explores the econometric relationship between the aggregate gross loan portfolio, operational efficiency, and the average number of active borrowers of MFIs in India with the understanding that financial exclusion renders the poor vulnerable to monetary shocks. It was observed that a healthy aggregate gross loan portfolio (considered here as a proxy for asset position) and operational efficiency (ratio of administrative expenses to financial revenue) of an MFI does not hamper financial inclusion (number of active borrowers) in society, rather better financial performance of MFIs improves the financial inclusion at the macro level. Hence, the financial performance of an MFI does not come at the cost of social performance. The research paper further provides impetus to the policymakers in India to corroborate the MFIs with large asset values to efficiently allocate their resources to sustain many borrowers.
1. Introduction
Poverty is a multidimensional and intersectional concept. In the social sciences poverty is usually stated in at least twelve distinct senses (Spiker, 2007). Poverty can be understood with respect to material conditions, economic circumstances, and social positions as given in Table 1.1:
Table 1.1: Poverty in twelve discrete senses
| Material Conditions | Economic Circumstance | Social Position |
| Limited Resources | Standard of living | Lack of entitlement |
| Need | Inequality | Lack of basic security |
| Pattern of deprivation | Economic Position | Exclusion |
| Social Class | ||
| Dependency |
Needs are aligned with resources; inclusive of the lack of income, wealth, or resources to acquire or consume the possessions which they need. The World Bank uses this approach (Economic Circumstance) and describes poverty as a condition when the income level of a person falls below some minimum level necessary to meet basic needs. The threshold is set at USD 1.90 a day. About 9.2% of the world, or 689 million people, live in extreme poverty on less than USD 1.90 a day, according to the World Bank (Peer, 2021). India has come a long way to reduce the poverty level of the country, but poverty is a vicious cycle. The vicious cycle can be ebbed in a sustainable manner when the poor have access to financial institutions. Over a billion people in the world do not have access to formal financial services and around 200 million of these people live in India (Demirgüç-Kunt, Klapper, Singer, Ansar, & Hess, 2017). Financial inclusion ensures that the poor earn more, save more, shape their assets, and bolster themselves against external shocks. Financial inclusion helps in increasing the standard of living and social inclusion. The concept of Microfinance was hence realised as a tool to ameliorate the condition of the poor and increase financial inclusion. Rangarajan’s committee on financial inclusion defines it as:
The process of access to financial services and timely and adequate credit where needed by vulnerable groups such as weaker sections and low-income groups at an affordable cost (Rangarajan, 2008, p. 1).
The causation between economic growth, financial thickening, and financial inclusion has been well documented in India’s progress, predominantly since the economic reforms of the early 1990s. The eleventh five-year plan (2007-12) of the Government of India further stressed the enterprises of financial inclusion with its extensive emphasis on “inclusive growth” (Singh & Tandon, 2012).
The Self-Employed Women’s Association (SEWA) cooperative bank established in 1974 in India, heralded the facility of banking services to poor women working in the unorganized sector in Gujarat (Joshi, Luca, Sahy, & Cortes, 2014). Members of SEWA subsume- trade unions, cooperatives, producers’ groups, service organisations, networks, alliances, federations, and self-help groups (SHGs). When a group of 10–20 women from comparable economic circumstances compose themselves into groups and advance loans or money among each other once they’ve hoarded a substantially fixed amount of money, they form a Self-Help Group (SHG). National Bank for Agriculture and Rural Development (NABARD), National Credit Fund for Women/Rashtriya Mahila Kosh (RMK) under the Ministry of Woman and Child-development and Small Industries Development Bank of India (SIDBI) had also promoted SHGs by imparting credit facilities to women members of poor households (Chaudhuri, Bhadra and Ghosh 2018). Later, they transformed into non-banking financial companies (NBFCs), not-for-profit companies, and local area banks. This permitted the MFIs to accomplish better financial operations and upsurge their lending.
The Jan Dhan, Aadhaar, and Mobile (JAM) revolution has brought about a paradigm shift in the arena of financial inclusion to universalise digital payments in a suitable, safe, protected, transparent and affordable manner. The JAM eco-system has the dormant potential of upliftment from the grassroots level, hence, special emphasis is also being given to alleviating the economic inequalities and the burden of the vulnerable segments of the population, while attending to consumer protection and augmenting the power of customers to use the financial services in a sustainable and responsible fashion (Sharma, Sengupta, Roy, & Phukan, 2021).
The annual Financial Inclusion Index (FI-Index) calculated by RBI for India for the year 2021 stood at 53.9 as against 43.4 for 2017 registering a compound annual growth rate (CAGR) of 5.5% (Sharma, Sengupta, Roy, & Phukan, 2021) as indicated in Table 1.2:
Table 1.2: FI-Index and Sub-indices
| Year | Access | Usage | Quality | FI-Index |
| Mar-17 | 61.7 | 30.8 | 48.5 | 43.4 |
| Mar-18 | 63.9 | 33.7 | 51.4 | 46.0 |
| Mar-19 | 67.5 | 38.7 | 52.6 | 49.9 |
| Mar-20 | 71.6 | 42.0 | 53.8 | 53.1 |
| Mar-21* | 73.3 | 43.0 | 50.7 | 53.9 |
*Some of the data points are provisional.
Note: “The FI-Index constructed by the Reserve Bank is based on the three dimensions of financial inclusion, viz., ‘Access’, ‘Usage’ and ‘Quality’ with weights as 35, 45 and 20 percent respectively. The weights were determined to make the index forward-looking with higher weights for the deepening aspect of financial inclusion (‘Usage’ and ‘Quality’) (Sharma, Sengupta, Roy, & Phukan, 2021, p. 91).”
Microfinance or Microcredit is a banking service bestowed on the unemployed and financially underprivileged section of society aimed at increasing the financial inclusion of the lower income base. Microcredit stresses the provision of credit services to low-income clients, usually in the form of small loans for microenterprises and income-generating activities. Microfinancing institutions (MFIs) impart financial help in three ways:
- Microloans: – These loans are provided to borrowers with no collateral.
- Micro savings: – These savings accounts allow entrepreneurs to operate savings accounts with no minimum balance.
- Microinsurance: – These insurance plans have lower premiums than traditional insurance policies.
The Indian microfinance sector has observed remarkable progress over the past two decades, especially with schemes such as Pradhan Mantri Jan Dhan Yojana (PMJDY) which was initiated in 2014, has also imparted impetus to the adult population in almost every household to have access to the bank accounts (KPMG, 2021). The influence of smartphones and e-KYC (Know your customer) have further accelerated the reach of financial services. Banks, NBFCs, Financial Technology, and other financial entities are putting special emphasis on financial inclusion, especially Small Finance Banks that have expanded their client base and rendered financial services to client migrant labour workforce, low-income households, small businesses, and other unorganised sector entities. Therefore, Micro financing is further anticipated to upsurge in lending to micro-enterprises, small and marginal farmers, Self Help Groups (SHGs), etc. which form the backbone of the Indian economy.
Microfinance companies have contributed quietly to one of India’s biggest success stories. In the 12 months to June 2018, these companies have lent Rs. 52,000 crores to 26 million women borrowers, 99.8 percent of whom are repaying their loans regularly (Harsh Shrivastava, 2018).
The Modus operandi of an MFI
- The borrowers clear the eligibility criteria before any loan is granted. The selection process does not involve the possession of the financial guarantees (salary, assets, etc.) but the intent of the loan such as launching a new enterprise or self-employment with the help of interviews and application forms.
- The assurance that is required by banks in order to grant a loan is served by each borrower as a guarantor for the other members with the help of a solidarity mechanism such as self-help groups.
- MFIs provide strong support and training to the recipients of microloans to help them flourish in their plans and developments.
- The MFIs have flexible repayment methods to suit the borrowers and target audience, such as using weekly payment dates.
- The services are rendered in a way that has no counterparts in the traditional banking world such as group loans. The MFI grants a solitary microloan to the entire group, characteristically to the poorest borrowers without any guarantee. The solidarity of all group members generates a “social guarantee” who are responsible to the MFI as well as to their co-borrowers (BNP Paribas, 2016; Kaaya, 2016).
The outreach of MFIs in India has increased as Bihar, at Rs. 5,446 crores, accounted for the second largest portfolio in 2018, and lending in Assam has doubled in one year. MFIs are catering to over 55mn poor (2007) out of 270 crore people living below the poverty line in India, out of which 90% of them are women (Sharma A., 2015). In the study, “Role of Micro-Financing in Poverty Alleviation” it was observed that there was equity in loan distribution within the majority of the SHGs chosen for the study in India and though the drop-out rate was reported to be 15 % with an average membership tenure of 5 years, new members were admitted up to the extent of 9% (Jha, 2013).
Figure 1.2: Average of number of active borrowers from 28 Indian MFIs from 2010-2019
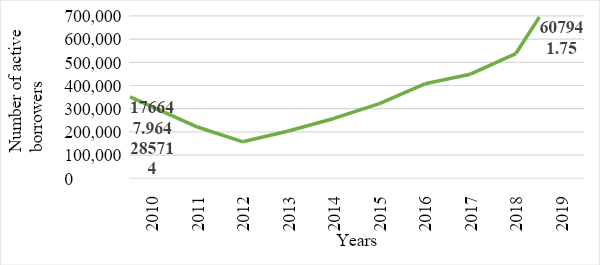
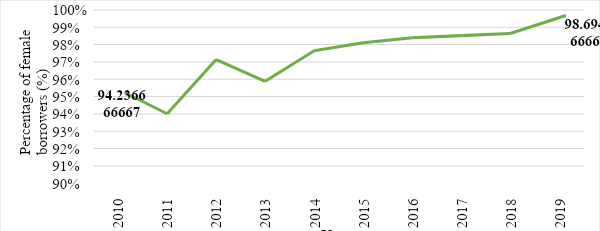
Figure 1.3: Average percentage of female borrowers from 12 Indian MFIs from 2010-2019
The Self-Help Group Bank linkage model has progressed into the current hybrid Self-Help Group (SHG) and Joint Liability Group (JLG) Models with the support of the Reserve Bank of India. The difference between SHG and JLG is that lending to SHGs is proportional to the size of savings that SHG has in the bank account, whereas the JLG model is chiefly used for lending only regardless of savings.
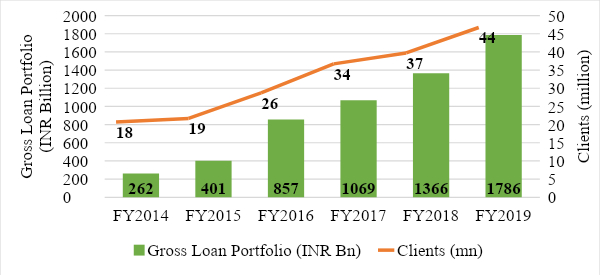
In the last five years microfinance portfolio has seen tremendous growth at a Compound Annual Growth Rate (CAGR) of nearly 48 percent from INR 26,200 Cr. to INR 1,87,400 Cr. in FY 19. The client base has also grown from 180 lakh to 440 lakh within the same time frame at a CAGR of 20 percent. As of 31 March 2019, 82 NBFC-MFIs hold the largest share of the portfolio in micro-credit with a total loan outstanding of INR68,868 Cr, which is 36.8 percent of the total micro-credit universe (KPMG, 2019, p. 6).
Figure 1.4: Historical JLG growth in portfolio size/number of clients
The Indian microfinance sector slumped in the second half of 2010-11 as the sector had to contract with increasing delinquency ratios and downgrades by rating agencies coupled with falling recovery rates i.e., from 99 percent to a meagre 10 percent, resulting in enormous NPAs, which nearly stalled the efficient functioning of MFIs (Singh S., 2020).
In comparison with other developing countries such as Bangladesh, the outreach of MFIs in India is still very low i.e., only 8% compared to 65% in Bangladesh which poses an impediment to0 financial inclusion (Nasir, 2013). In the study conducted (Ray & Mahapatra, 2019), it was observed that the value of assets of Indian MFIs worsened significantly during 2006-2013 and it negatively impacted their performance. It has also been witnessed that marketed Indian MFIs provide larger loans than non-commercialized MFIs which strays them from the purpose of financial inclusion (Wondirad, 2020).
2. Literature Review
There are two schools of thought with which MFIs can approach their undertaking and they are: – a welfarist approach to microfinance and an institutionalist approach. The welfarist gauges MFI’s accomplishments by values like social outreach and impact assessment while the institutionalists assess based on sustainability and profitability (Berguiga & Adair, 2015).
“The institutionalist approach focuses on creating financial institutions to serve clients who either are not served or are underserved by the formal financial system (Woller, Dunford, & Woodworth, 1999, p. 29).”
Most current studies have fixated on both schools of thought and contemporary consequences in light of both financial and social findings. This study aims to understand the association between both the approaches and how the focus on ‘institutionalist variables’ bring about a change in the ‘welfarist variables’ at a macro level and vice versa.
Numerous studies have been conducted to compute the efficiency and financial performance of the Indian MFIs with the help of various mechanisms like the ‘Stochastic Frontier Method’, ‘Stochastic Distance Function’, and ‘Multi-Criteria Decision Making. However, the usage of any such approach is beyond the scope of this study.
In a study conducted by (Rupa, 2014), in an attempt to assess the financial performance of Microfinance Institutions in India during the fiscal year period 2007 to 2011 (2007-08 to 2011-12), it was observed that the Indian MFIs have showcased better efficiency and productivity as measured by the ratio of operating expense to loan portfolio and average salary by GNI per capita. The gross loan portfolio of Indian MFIs has accounted for more than 7 percent of the sector’s worldwide loan portfolio size. One of the major gaps in the study is that there is no substantiation as to how the decent financial performance of an MFI translates into better social performance, in other words, the relationship between the two variables is not elaborated.
Hence, (Bharti & Malik, 2021) revealed in their findings that with the inclusion of social output, the efficiency of MFIs improves across various categories. However, (Mia, Pellegrina, Damme, & Wijesiri, 2019) revealed, in contrast, that the MFIs with a more intense social strategy may have suffered a decrease in their operating efficiency to maintain their social mission. Moreover, MFIs granting smaller loans are lucrative and profitable in the long run. This was also suggested (Sinha & Navin, 2020) that leasing smaller loans is less costly which might be owing to the closeness of the borrowers with comparable financial requirements. Therefore, an MFI can attain sustainability and efficiency without compromising on the social purpose of providing microcredit to poor clients. But, (Woller G., 2007) refuted this view in his study revealing that the relocation of MFIs to escalate in the market, away from their traditional poor customer (referred to as mission drift) has caused the MFIs to not utilize their assets effectively to generate returns for higher profitability. This means that social performance is necessary to retrieve higher profits and ensure the sound financial performance of the MFI. Despite a 48% rise in the gross loan portfolio, the asset quality of MFIs has continued to depreciate with a portfolio at risk (PAR) rising across institutions excluding NBFC-MFIs (Gopakumar, 2019).
This study aims to resolve the conflict between the above two findings by different research papers i.e. if focusing on social performance leads to better financial performance or deteriorates it and then further shed light on the relationship between the asset position of the MFIs and their returns to society i.e., increase in financial inclusion (social performance). In the study conducted by (Miled, Younsi, & Landolsi, 2022), observed results confirmed that the countries where MFIs have higher gross loan portfolios per capita have lower income inequality, hence, corroborating the positive outcome of microfinance at the macro level due to which one of the variables chosen in the study as a proxy for asset position is gross loan portfolio. This research paper aims to fill that gap in the literature by further selecting the variable ‘average number of borrowers’ as an indicator of social performance and then examining its relationship with financial performance.
3. Statement of the problem
The current modification in the microfinance sector has posed qualms about the capability of MFIs to balance financial and social objectives. The current study attempts to analyze and correlate the social and financial performances of Indian MFIs with an objective to understand the consequences of a better loan portfolio (a proxy for asset position in this case) and operational efficiency of an MFI on financial inclusion i.e., number of active borrowers in India (an indicator of social performance).
4. Hypotheses
The better asset position (aggregate gross loan portfolio) and operational efficiency (ratio of administrative expenses to financial revenue) of an MFI come at the cost of financial inclusion (number of active borrowers) of the low-income earning section of the society.
5. Research Methodology
5.1. Source of the data
The data needed for the analysis were taken from Microfinance Information Exchange (MIX) market database hosted by World Bank.
5.2. Exploratory Data Analysis
All three variables, namely, aggregate gross loan portfolio, the ratio of administrative expenses to financial revenue, and an average number of active borrowers were checked for missing values and outliers. While the missing values were not present in any of the variables, the outliers were removed.
There are approximately 250 MFIs in India, as well as NGO-managed corporations and entities, of which 168 are affiliated with Sa-Dhan (The association of community development finance institutions). There are 47 non-bank-micro-funding institutions (NBFC-IMF) registered with the Network of Microfinance Institutions (MFIN). Only those MFIs have been selected for which all the data required to carry out the study was available. Then, the outliers were removed followed by the tabulation of descriptive statistics, and the correlation for each variable was checked. Finally, 35 Indian MFIs have been selected to confirm or reject the hypothesis.
5.3. Period of Study
The year under consideration is 2019.
5.4. Data Type
Cross section
5.5. Tools used for the study
This study was based on a quantitative research approach. Numerical data analysis in this study was done using the statistical technique of multiple regression analysis. R program and Microsoft Excel software were used to perform the analysis on the numerical data Cross section.
5.6. Limitations of the study
- The limitations intrinsic to statistical tools apply to this study also.
- Non-availability of certain variables for all the MFIs from MIX has restricted this study and the sample size to 35.
- Non-availability of data after the year 2019.
5.7. Formula/ Definitions according to MIX Market
Table 5.1: Variables used for the purpose of the research
| S.no | Variable | Type | Formula/Definitions | Role |
| 1 | The average number of active borrowers (ANAB) | Dependent | The number of individuals who currently have an outstanding loan balance with the financial institution or are primarily responsible for repaying any portion of the gross loan portfolio. Individuals who have multiple loans with a financial institution should be counted as single borrowers. | Social Performance/Financial Inclusion |
| 2 | Average Gross Loan Portfolio (USD) (AGLP) | Independent | All outstanding principal for all outstanding client loans, including current, delinquent, and restructured loans, but not loans that have been written off. It does not include interest receivable. | Asset position |
| 3 | Operational efficiency | Independent | the ratio of administrative expenses to financial revenue (values for administrative expenses and financial revenue are independently divided with the help of formulas sourced from MIX Market) | Quality and Service |
6. Quantitative Results
6.1. Variables chosen:
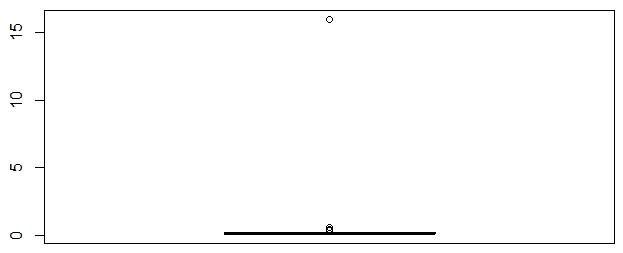
In order to facilitate the process of dealing with data, the variables on the average gross loan portfolio and the average number of active borrowers have been transformed using logarithmic monotonic transformation. As can be seen from figures 6.1 and 6.2, the laglp and lanab do not have outliers. However, data on another variable in the analysis, namely, the ratio of administrative expenses to financial revenue, has few outliers. Consequently, the MFIs with outliers in the data set have been removed before analysis was carried out. Finally, the data analysis was carried out on 35 data points.
laglp = log10 (Average gross loan portfolio)
lanab = log10 (Average number of active borrowers)
aetfr = Administrative expense to financial revenue
Number of observations = 35
6.2. Exploratory analysis:
Figure 6.1: Boxplot of laglp
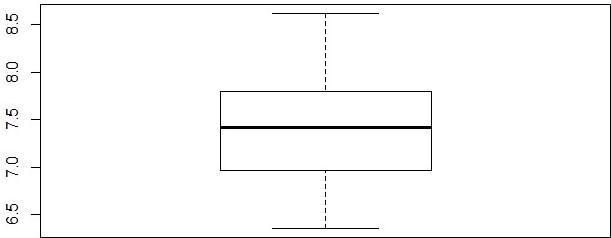
Figure 6.2: Boxplot of lanab
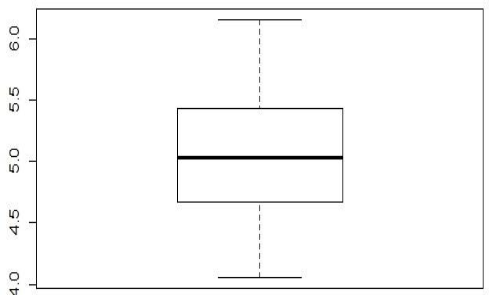
Figure 6.3: Boxplot of aetfr
6.3. Descriptive Analysis:
We may see in table 6.1 that the variables are visibly clustered around central values with a low level of deviations from their arithmetic mean. However, the range of values is quite considerable for aetfr while the same for other variables (i.e., lanab and laglp) are not as large. From table 6.2 we observe a clearly visible positive correlation between laglp and lnab. This means that with an increase in the average gross loan portfolio, the average number of active borrowers also increases. But with an increase in the average number of active borrowers the administrative expenses per unit of revenue earned decrease. This is a good sign for the industry as it means that the MFIs with better asset positions have better outreach to the beneficiaries at a lower cost. This in turn implies, that more and more people have access to financial resources rather than only a few repeated customers leading to a better distribution of resources necessary for social welfare.
Table 6.1: Summary Results
| Characteristics | lanab | laglp | lanab |
| Maximum | 6.153 | 8.621 | 0.3467 |
| Minimum | 4.056 | 6.352 | 0.0774 |
| Mean | 5.082 | 7.452 | 0.1473 |
| Median | 5.038 | 7.425 | 0.1345 |
| Mode | 5.116 | 7.483 | 0.0818 |
| Standard Deviation | 0.560 | 0.616 | 0.0558 |
| 1st Quartile | 4.697 | 7.094 | 0.1145 |
| 3rd Quartile | 5.431 | 7.795 | 0.1715 |
Table 6.2: Correlation Coefficients
| lanab | laglp | aetfr | |
| lanab | 1.000 | ||
| laglp | 0.982 | 1.000 | |
| aetfr | -0.340 | -0.437 | 1.000 |
6.4. Regression Results:
We have already seen a strong positive correlation between anab and aglp. However, in order to see if the increase in aggregate gross loan portfolio implies a significant increase in the number of active borrowers more efficiently, we had run a regression of lanab on laglp and aetfr. Below is the regression equation for the same.
lanabi = β1 + β2*laglpi + β3*aetfri + ei
where,
i: index of observations and i = 1(1)35
β1: Constant or the intercept term
β2: Partial regression coefficient for aggregate gross loan portfolio which is the proportion of variation in an average number of active borrowers explained by the average gross loan portfolio controlling for the effects of the ratio of administrative expenses to financial revenues.
Β3: Partial regression coefficient for average gross loan portfolio which is the proportion of variation in the average number of active borrowers explained by the ratio of administrative expenses to financial revenues. Controlling for the effects of the average gross loan portfolio.
ei: Error term that explains the part of the variation in the average number of active borrowers, which cannot be done otherwise.
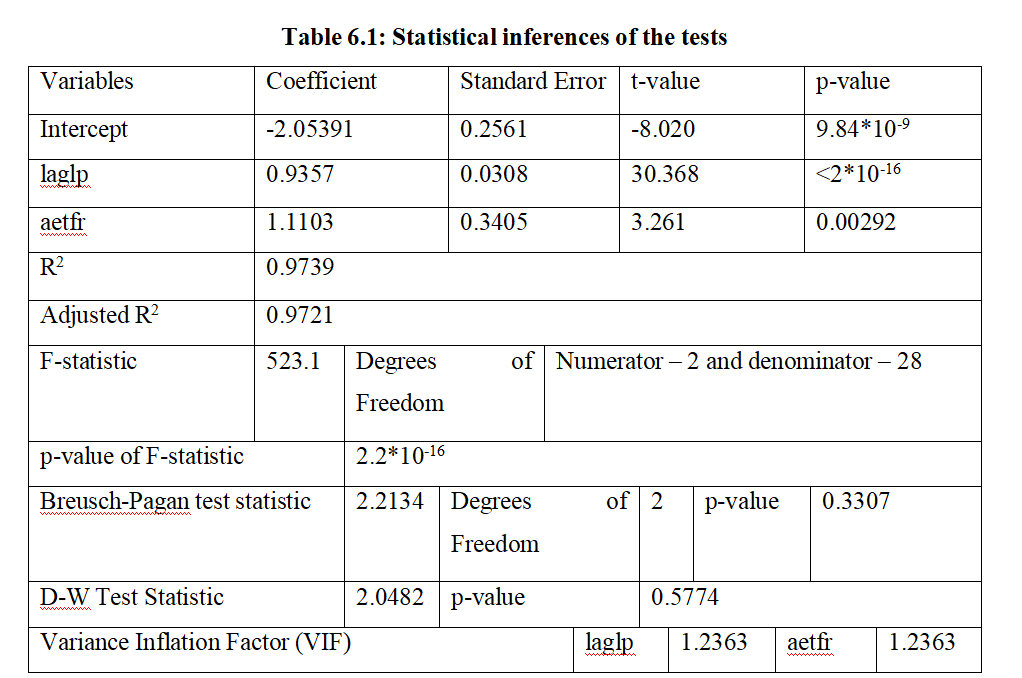
6.5. Regression explanation
From table 6.1, we see that t values of intercept, as well as laglp and aetfr, are statistically significant at a 5% level of significance. The intercept term has a negative sign before it which implies that there is an autonomous demand for funds from the MFIs by the local inhabitants. The coefficient of laglp of 0.9375 implies that every 1% increase in gross loan portfolio helps in creating an almost 1% increase in the number for average number of active borrowers. This is a positive sign signifying higher than expected community outreach of the MFIs with higher gross loan portfolios. The operational efficiency of the MFIs also does not act as a big deterrent as every additional active borrower adds a small amount to the administrative expenses implying a higher number of active borrowers better is than their administrative management. This will allow MFIs to recycle the revenue earned to generate higher business, which in turn will lead to better welfare for the community. The overall strength of the regression is very good, which means that aglp and aetfr together help in creating more and more borrowers. The model is also free from the presence of heteroscedasticity, autocorrelation, and collinearity.
7. Conclusion
From the data analysis, we may reject the assertion that better asset position and operational efficiency of an MFI come at the cost of financial inclusion of the low-income earning section of society. In other words, MFIs may look for asset creation and improve operational efficiency without sacrificing societal goals. From the regression result, the study suggests that the higher the aggregate gross loan portfolio or asset position of an MFI, the higher the average number of active borrowers. Hence, better social performance enhances financial performance.
This may be interpreted as the microfinance institutions with higher average gross loan portfolios have higher outreach to the people in need of finances and thereby, help in reducing inequality. Results from this study suggest that increase in administrative expenses can be met by financial revenues generated by the MFIs. As this study concentrates on the performance of many MFIs in India in a given year, it may be inferred that the MFIs are able to manage their incremental expenses from revenues generated in the short run. This in turn opens a window of opportunity for MFIs to restrict their incremental administrative expenses to less than the revenues generated from business expansion.
This may be attained by means of adopting technological interventions such as online applications and approvals of loans on a larger scale in the long run. This seems quite plausible given the proliferation of smartphone-based technologies in India during the last decades and which is expanding. Hence the MFIs with a large pool of resources and an intent to serve society by reducing economic inequality should be encouraged by the government to efficiently allocate their resources through appropriate economic policies to strengthen social inclusion which will play a critical role in India’s inclusive growth policies.
Disclaimer: The views and opinions expressed by the author do not necessarily reflect the views of the Government of India and Defence Research and Studies
Title image courtesy: https://m.economictimes.com/
References
Berguiga, I., & Adair, P. (2015, 04). Social vs financial performance of microfinance institutions Adair Berguiga.
Bharti, N., & Malik, S. (2021, 06). Financial inclusion and the performance of microfinance institutions: Does social performance affect the efficiency of microfinance institutions? Social Responsibility Journal, 18(4), 858-874.
BNP Paribas. (2016, June 30). How does an MFI work? Retrieved 03 21, 2022, from https://group.bnpparibas/en/: https://group.bnpparibas/en/news/mfi-work#:~:text=What%20is%20microfinance%20%3F,loans%2C%20savings%20solutions%20and%20more.
Demirgüç-Kunt, A., Klapper, L., Singer, D., Ansar, S., & Hess, J. (2017). The Global Findex Database. The World Bank Group.
Gopakumar, G. (2019, 11 26). Live Mint. Retrieved from https://www.livemint.com/: https://www.livemint.com/industry/banking/microfinance-loan-portfolios-jumps-48-asset-quality-deteriorates-11574743044016.html
Harsh Shrivastava. (2018, 11 23). Nine P’s that are making microfinance work in India. Retrieved 02 18, 2022, from https://www.financialexpress.com/: https://www.financialexpress.com/industry/banking-finance/nine-ps-that-are-making-microfinance-work-in-india/1391380/
Imai, K., Gaiha, R., Thapa, G., & Annim , S. (2010). Analysis of Poverty Reducing Effects of Microfinance from a Macro Perspective: Evidence from Cross-Country Data. Retrieved 03 22, 2022, from https://www.researchgate.net/publication/47280617_Analysis_of_Poverty_Reducing_Effects_of_Microfinance_from_a_Macro_Perspective_Evidence_from_Cross-Country_Data
Jha, S. (2013, 04 27). Role of Micro-financing in Poverty Alleviation. SSRN Electronic Journal. Retrieved 02 18, 2022, from file:///C:/Users/Nayan/Downloads/SSRN-id2442756.pdf
Joshi, S., Luca, L. D., Sahy, H., & Cortes, M. (2014). Learning from catalysts of rural transformation. Rural Employment and Decent Work Programme, International Labour Organization.
Kaaya, D. B. (2016). Retrieved from The Nairobi Law Monthly: https://nairobilawmonthly.com/index.php/2016/09/01/microfinance-institutions-our-biggest-weapon-against-poverty/
KPMG. (2019, 12). Microfinance – contributions to financial inclusion; opportunity and challenges ahead. Retrieved 03 21, 2022, from home.kpmg/in: https://assets.kpmg/content/dam/kpmg/in/pdf/2019/12/MFI-Microfinance-contributions-to-financial-inclusion.pdf
KPMG. (2021, 03). Rejuvenating microfinance in India – embracing digital. Retrieved from home.kpmg/in: https://assets.kpmg/content/dam/kpmg/in/pdf/2021/03/microfinance-digital-fintech-mfi-technology-finance.pdf
Mia, M. A., Pellegrina, L. D., Damme, P. V., & Wijesiri, M. (2019, 12). Financial Inclusion, Deepening andEfficiency inMicrofinance Programs: Evidence fromBangladesh. European Journal of Development Research, 31(4), 809-835.
Miled, K. B., Younsi, M., & Landolsi, M. (2022). Does microfinance program innovation reduce income inequality? Cross-country and panel data analysis. Journal of Innovation and Entrepreneurship, 11(1), 1-15.
Nasir, S. (2013). Microfinance in India: Contemporary Issues and Challenges. Middle-East Journal of Scientific Research, 15(2), 191-199. Retrieved from Finflux.
Peer, A. (2021, 08 23). Global poverty: Facts, FAQs, and how to help. Retrieved from worldvision.org: https://www.worldvision.org/sponsorship-news-stories/global-poverty-facts#:~:text=About%209.2%25%20of%20the%20world,or%20about%20%2435.28%20per%20day.
Rangarajan, C. (2008). Report of the committee on financial inclusion. GOI. Retrieved from https://www.findevgateway.org/sites/default/files/publications/files/mfg-en-paper-report-of-the-committee-on-financial-inclusion-jan-2008.pdf
Ray, S., & Mahapatra, S. K. (2019, 01). Asset quality and performance: an empirical study of Indian microfinance institutions. International Journal of Services Economics and Management, 10(3), 248-263.
Rupa, R. (2014, 11). A study on Financial performance of MFIs in India. The International Journal Of Business & Management, 2(10), 187-193.
Sharma, A. (2015, 08 27). The role of microfinance in reducing poverty. 2nd International Conference on Science, Technology and Management. 4, pp. 351-357. New Delhi: International Journal on Science, Technology and Management.
Sharma, A. K., Sengupta, S., Roy, I., & Phukan, S. (2021, 09 16). Financial Inclusion Index for India. Economic Times Financial Inclusion Summit . RBI Bulletin September 2021. Retrieved 03 19, 2022, from rbi.org.in: https://www.rbi.org.in/Scripts/BS_ViewBulletin.aspx?Id=20502#:~:text=The%20annual%20FI%2DIndex%20computed,CAGR)%20of%205.5%20per%20cent.
Singh , S. (2020, Sep 11). Microfinance: Reaching out to the Bottom of the Pyramid. Retrieved 02 13, 2022, from rbi.org.in: https://www.rbi.org.in/scripts/BS_ViewBulletin.aspx?Id=19775
Singh, A., & Tandon, P. (2012, 06). Financial inclusion in india an analysis. International Journal of Marketing ,Financial services and Management Research, 1(6), 41-54.
Sinha, P., & Navin, N. (2020). Social and financial performance of MFIs: complementary or compromise? Vilakshan – XIMB Journal of Management, 18(1), 42-61.
Spiker, P. (2007). Definitions of poverty: twelve clusters of meaning. Poverty: An international glossary, 229-243.
Woller, G. (2007). Trade-offs between Social & Financial Performance. Journal of Microfinance / ESR Review, 2(9), 15-19.
Woller, G. M., Dunford, C., & Woodworth, W. (1999). Where to Microfinance? International journal of economic development, 1, 29-64.
Wondirad, H. A. (2020). Competition and microfinance institutions’ performance: evidence from India. International Journal of Corporate Social Responsibility.